

Preston Jordan
We often focus on voter turnout, but as reported by throughout California this regards the percent of registered voters that submitted a ballot, whether or not they voted in a particular contest on the ballot. Our League is terming the latter participation, and it is particularly relevant for our local elections. Many voters leave their ballots blank for those elections. Consequently participation is a better metric than turnout for voter engagement with their local democracy.
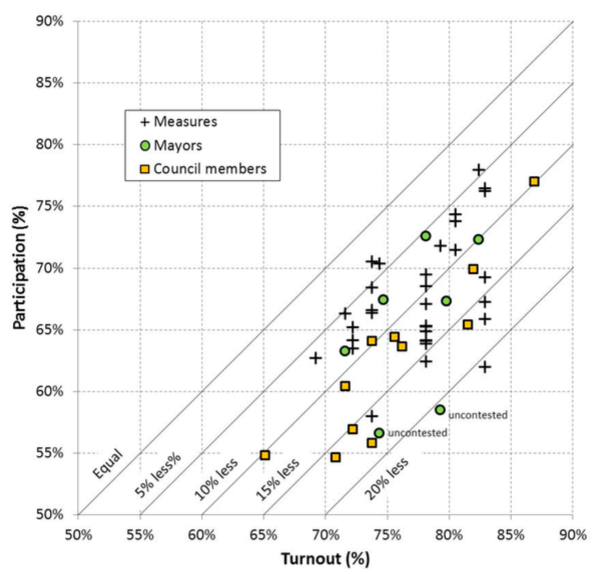
Below is a graph of participation versus turnout for all measures and contests to fill single seats in Alameda County in November 2016. As shown, the average participation is about 10% less than the average turnout. For instance, if 75% of registered voters submit a ballot, it is likely that only 65% voted in a particular city contest.
Participation is the metric relevant to local Leagues’ service educating and engaging voters. Neither the Registrar nor Voter’s Edge report participation currently. The Registrar also does not currently report information sufficient to calculate participation in multi-seat elections, such as those for Albany and Emeryville City Council, and Berkeley’s School and Rent Stabilization Boards. Your League is working to change this. It recently requested the Alameda County Council of Leagues to take up this issue. The Council voted unanimously to engage with the Registrar on these matters of election reporting.
Thank you for supporting Making Democracy Work!
Preston Jordan, Action Director, action@lwvbae.org
Participation Versus Turnout
All League News